Lifecycle of data on BlueMix - The Pulse Sales App Story
This post explores how data that is created from users using mobile apps in a sales scenario ends up useful to the business and can help in improving customer retention or satisfaction or optimizing sales staff. This is illustrated using a combination of BlueMix services that was announced at IBM Pulse
About the scenario
This user scenario is that of the fictional Homestead company that we introduced at IBM Pulse mainstage demo. The sales associates are using the mobile app to help followup with customers, maintain better relations and enhance the overall buying experience. In short they go from being sales helper to personal shopper.
Fast forward to year from this launch of this, Homestead has this deployed to several stores and several hundred sales associates are using this app in servicing customers. The need is for the business to reason about this adhoc customer notes that has been captured by the sales associates.
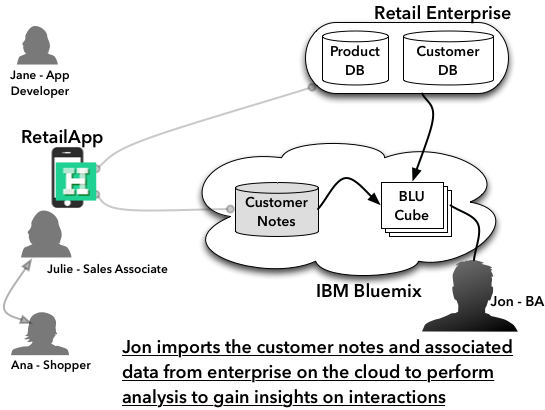
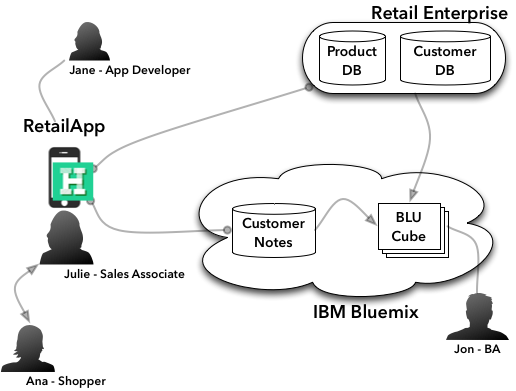
The overall context for this post starts with the below cartoon on various interacting roles and system parts.
Step 0: Building the app
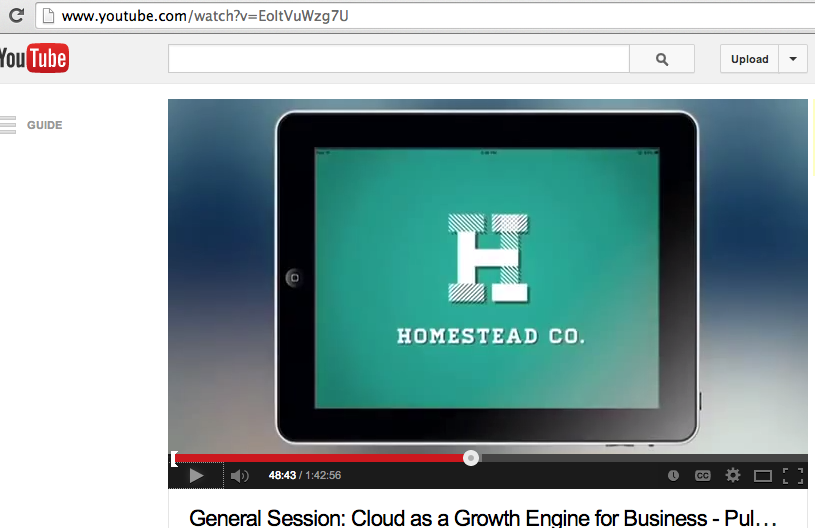
The developer at Homestead built the app, that was showcased at IBM Pulse goto 48:43 to see the app
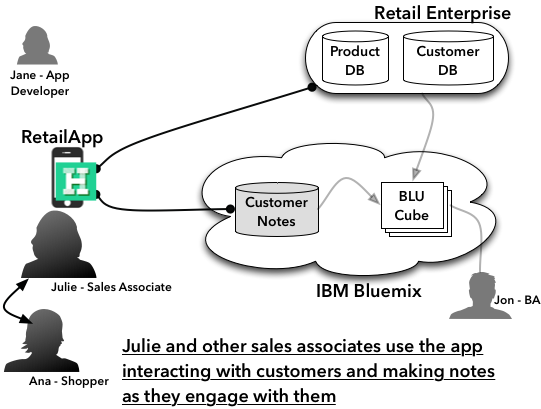
Step 1: Data collection as use increase
As various sales associates use the app, data is being populated on the BlueMix/Cloudant. The structure of the single JSON document as a sales associate interacts with a customer is as follows. See this video that shows a document in data console on the cloud.
{
        "lastinteractiondate": "2012-07-11",
        "firstname": "Fama",
        "lastname": "Stres",
        "products": [
            "Ski Boots",
            "Powerbars"
        ],
        "address": {
            "city": "london",
            "state": "ny",
            "localphone": "3084328"
        },
        "customerId": "57fea3df-d6f7-467b-8420-ad427c05dafc",
        "orders": [
            {
                "ordid": 15122,
                "status": "open",
                "comments": "Ship to my home address for the boots",
                "filedon": "2012-07-10"
            },
            {
                "ordid": 12920,
                "status": "closed",
                "comments": "Asked about women's small ski mask",
                "filedon": "2012-07-01"
            }
        ]
}
The cartoon describing the interaction/flow is shown below
Step 2: Data ETL into analytics tool
Since this data has been collected over few months, its best to export it to an analytics engine for performing analysis. This is facilitated using IBM DataStage 9.1.2 tool to extract the JSON documents, normalize and map them into tables on the BLU Acceleration service. See the video here
Step 3: Analyzing the data
Now that the data is available on the cloud for analysis using BLU Acceleration service, the business analyst/data scientist can use the power of R to see the customer distribution by state. You can see the video of the interaction here. You can see the normalized tables around customers, orders and products that was created in the previous step in this video.
The cartoon describing the interaction/flow is shown below