Analyzing Buffetts Chairman letters using Watson Tone Analyzer
Followup to the Topic Modeling of Warren Buffett’s Chairman Letter to his shareholders, I decided to use Watson’s experimental service - Tone Analyzer on IBM Bluemix.
It was a simple exercise since I already had the data in text format. Workflow for this was -
- Used my Bluemix account to instantiate a Tone Analyzer instance. Got the creds that I used below.
- I wrote a simple Python script to collect the JSON from Tone Analyzer, using simple curl commands
curl -X POST -H "Content-type: text/plain" --data @2014.txt "https://xxxx:yyyy@gateway.watsonplatform.net/tone-analyzer-experimental/api/v1/tone" > 2014.tone.json- Wrote a Python script to get the normalized score for all the children per year in the YYYY.tone.json
- Used R to analyze the data using MDS, Timeseries and Parallel Coordinates.
Below is the Multi-Dimensional Scaling plot of the various tonal scores for years 1977-2014 -
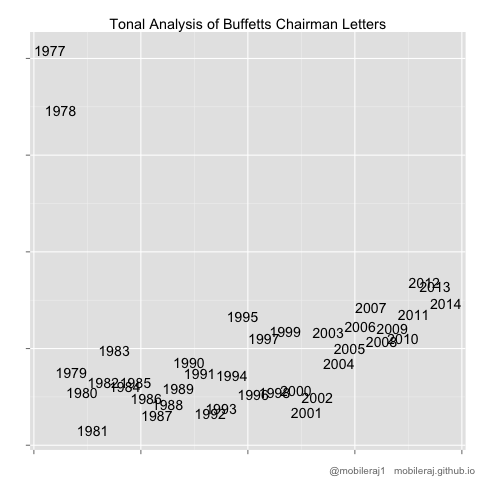
As you can see 1977 and 1978 are seen as anomalies, looks like these two years didnt have any anger words per Tone Analyzer. So I wanted to see how the rest of the years clustered, so re-ran the MDS using 1979-2014
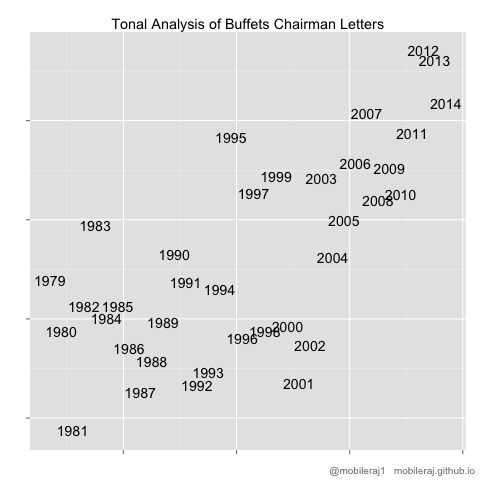
This in itself is interesting. I will be doing further analysis of why this is and if I can tease apart any patterns in a subsequent post.
Then I moved to looking at the tones across time, using timeseries plot
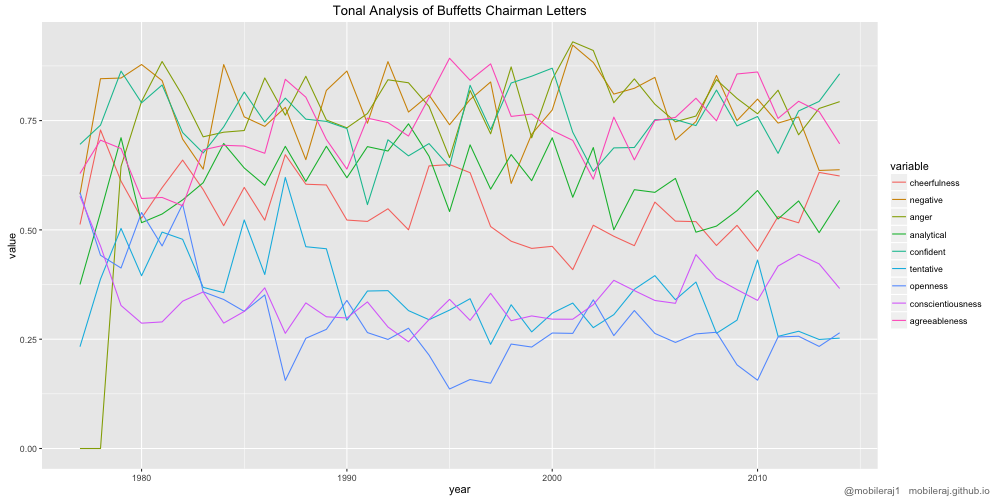
Nothing interesting in this aggregate plot, so I will be trying to see if there is any visual way to get the signals out… Stay tuned.