Atari Vax Email Network Analysis
I saw the email posting from Jed Margolin about his emails from Atari. I wanted to see if I can visualize the email as a network. Here is the brief writeup of this mini-project.
Extracting Data
The emails are in text format for the years 1983 to 1992. Its available on his web site I wrote a simple Python script to extract the tuple (from person, to person, timestamp) for the entire set of email text files on his site. Ref#2 provides the python source for it. It uses a simple state machine model of 3 states - from/to/reset to extract and populate the data list which I save it as pickle.
Getting a network
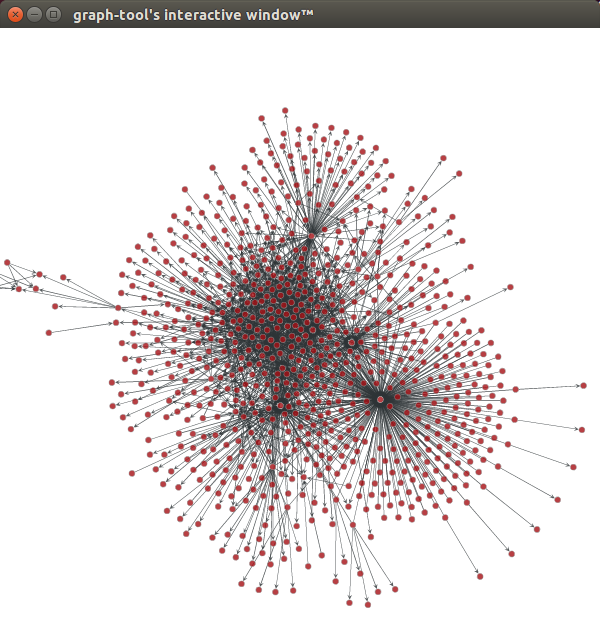
I then used NetworkX library to create a GraphML file from the data extracted. You can see that in Ref#4
You can see the visualization of the network using graph-tool below -
Basic analysis
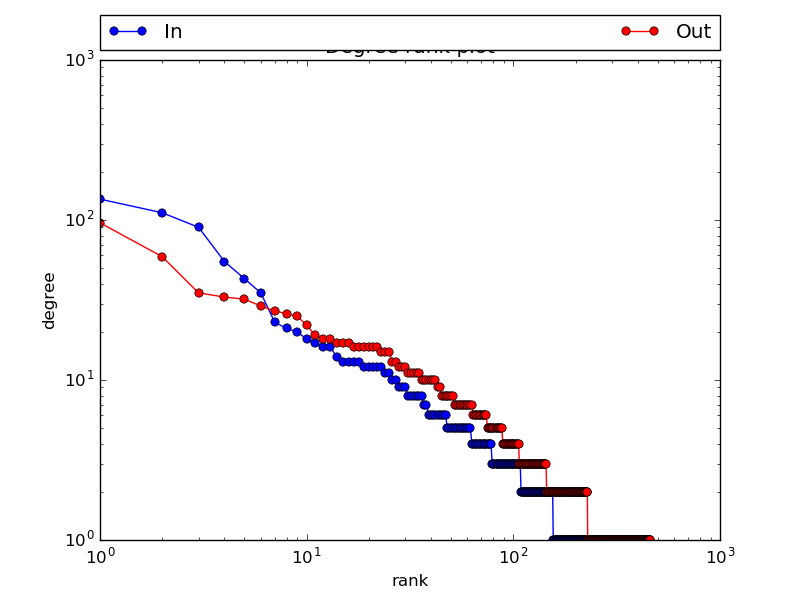
Used networkX to do some basic degree distribution and pagerank analysis to get the top 5 accounts.
The degree distribution, as other email distributions it follows power law.
Running pagerank analysis yields the top five accounts as -
@SYS$MAIL:JUNK, MARGOLIN, @SYS$MAIL:ENGINEER, @SYS$MAIL:EVERYBODY,KIM::MARGOLIN, FARRAND, SKIP, STUBBEN, @SYS$MAIL:EE
Feel free to clone/fork my Github project and play with it.
References
[1] Source of the data - http://www.jmargolin.com/vmail/vmail.htm
[2] Python notebook to parse text and extract network list -https://github.com/mobileraj/atariGraph/blob/master/main.ipynb
[3] Github repo for this project - https://github.com/mobileraj/atariGraph
[4] Python notebook to get a GraphML file - https://github.com/mobileraj/atariGraph/blob/master/PyGraphML.ipynb
[5] Python notebook for doing graph analysis - https://github.com/mobileraj/atariGraph/blob/master/Graph%20Analysis.ipynb